Understand your Dexa report
Here you can find an explanation of the terms used in your Dexa report, so you can gain a better understanding of the results.
Gain a Better Understanding of Your Physical Body
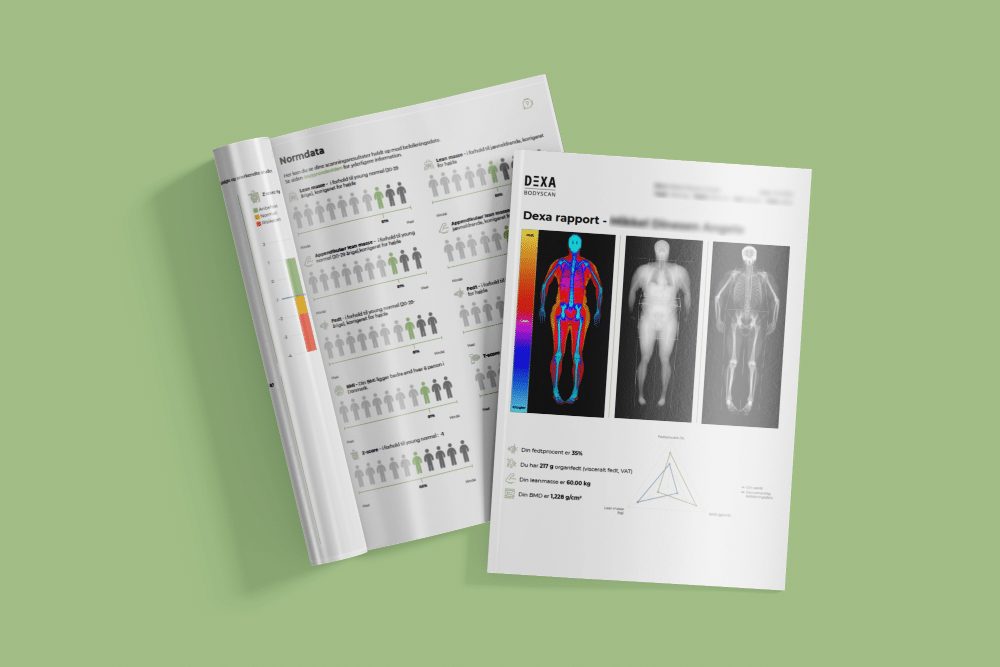
You have just had a Dexa body composition scan at Dexa Bodyscan—a precise insight into your body’s composition right now. The scan functions as a compass that guides you toward a better understanding of your physical condition. You receive the necessary knowledge to make informed decisions, plan your training, and achieve the results you dream of on your journey toward well-being.
If you have questions about the data, we recommend that you contact your primary care physician or seek help from a specialist.
See our partners
Glossary
Appendicular lean mass
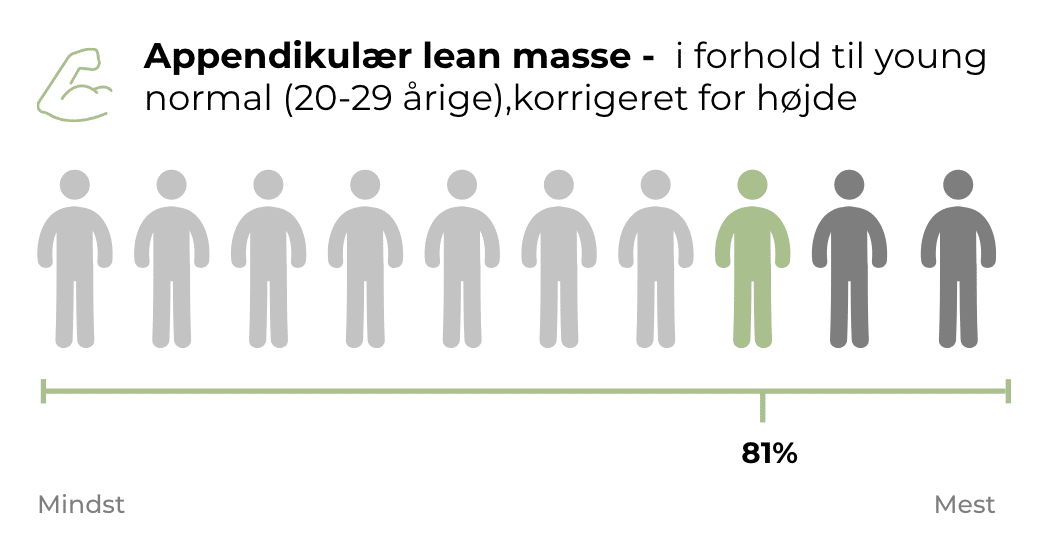
Lean mass measured on the appendicular parts of the body, which include the arms and legs.
This measurement helps assess the amount of muscle mass and can be an indicator of nutritional status or physical fitness. Muscle mass is measured more precisely through the appendicular lean mass, as there are fewer non-muscular lean structures (organs) in the arms and legs that affect the measurement than if the torso and head were included.
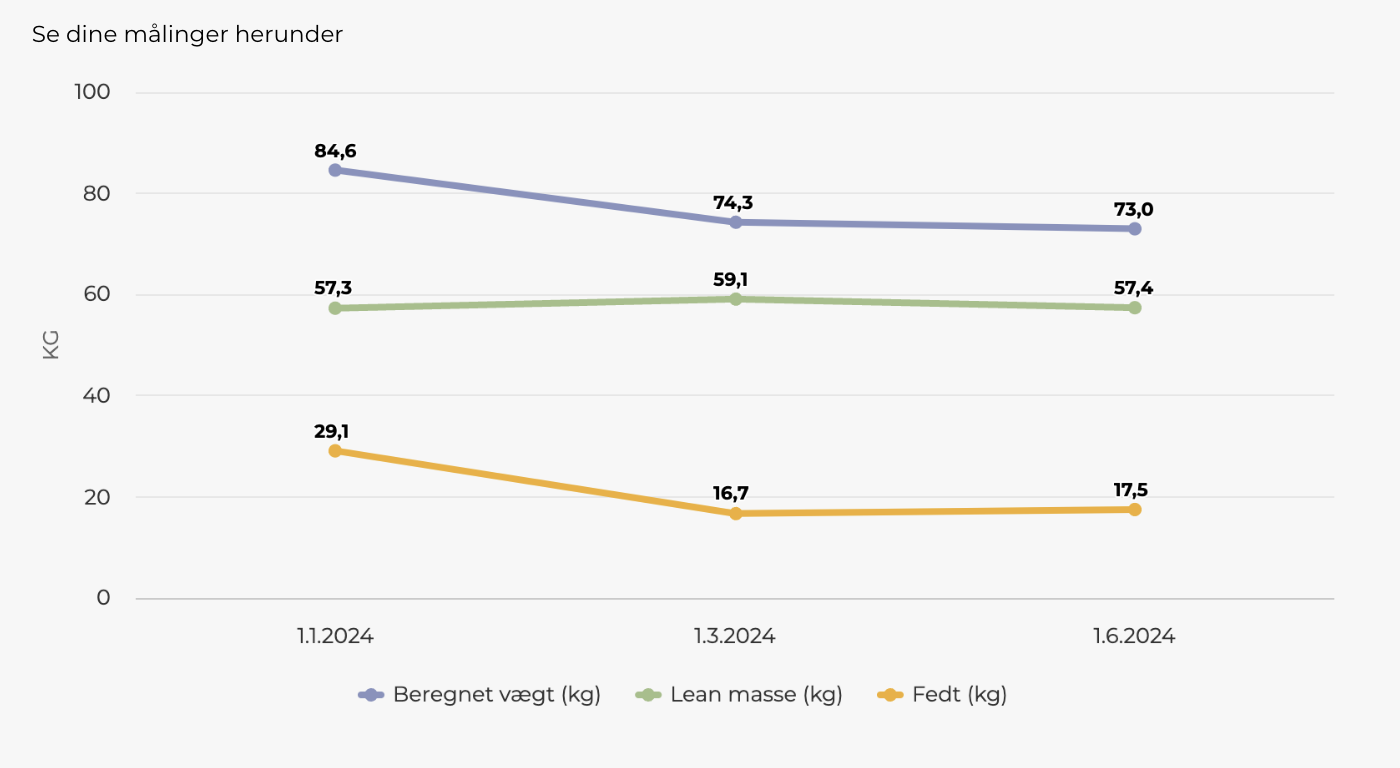
Calculated weight
The body weight calculated through the Dexa body composition scan. Calculated weight will often differ slightly from the weight measured on a scale.
The weight determined by the Dexa scanner is based on the fact that different tissues in the body allow varying amounts of X‑rays to pass through due to their different densities. The scanner then calculates the volumes of the various tissues and estimates the weight based on known densities. These calculations may vary slightly from a conventional scale measurement.
Body mass index (BMI)
Body mass index (BMI) is the ratio of weight to height. A high BMI (≥25 is categorized as overweight, while ≥30 is categorized as obese) is associated with weight-related health risks. However, BMI has several limitations (see below).
Read more here
BMI relates your total weight to your height. However, it does not take your body composition into account. It does not differentiate between bone tissue, lean mass, and fat tissue, and therefore cannot tell you which tissues in your body contribute what amount to your weight. Consequently, BMI does not indicate where the fat is located in your body. These are important limitations of BMI.
A high BMI thus indicates “excess weight,” not necessarily “excess fat.” For example, individuals with high muscle mass can have a BMI over 25 even though the extra weight is due to high lean mass rather than large amounts of fat tissue. Your body composition is mapped by a Dexa scan, which provides a significantly more nuanced insight than BMI.
Read more about high BMI is associated with health risks here

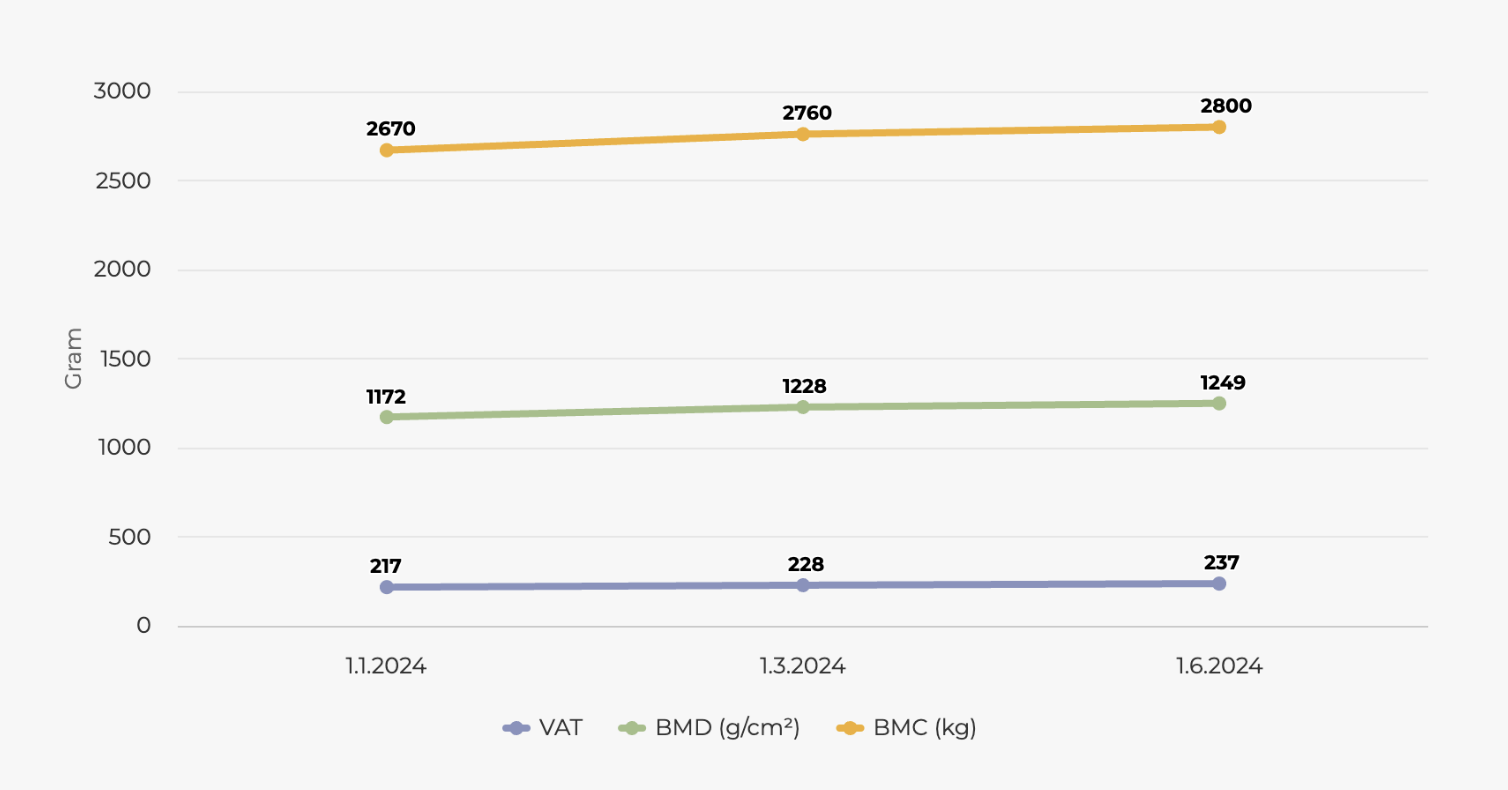
Bone mineral content (BMC)
Bone Mineral Content (BMC) measures the total amount of minerals in the bone tissue and is used, among other things, to evaluate bone strength and density.

Bone mineral density (BMD)
Bone Mineral Density (BMD) is a measurement of bone density, crucial for assessing bone health and the risk of fractures. High BMD indicates strong bones, while low BMD may signal bone loss and an increased risk of osteoporosis.
Read more here
The BMD measurement is converted into a T‑score and a Z‑score, which serve as overall indicators of bone health. A healthy lifestyle—avoiding smoking and excessive alcohol, a balanced diet and regular exercise—can reduce the age-related decline in BMD.
A Dexa body composition scan provides a full-body picture of your bone mineral density and overall bone health, and repeated scans can track changes in your BMD over time. A Dexa osteoporosis scan specifically focuses on the lower back and hip region to diagnose osteoporosis. The two measurements serve different purposes and should not be compared.
Learn more about the effects of exercise, alcohol and smoking on bone health and osteoporosis risk
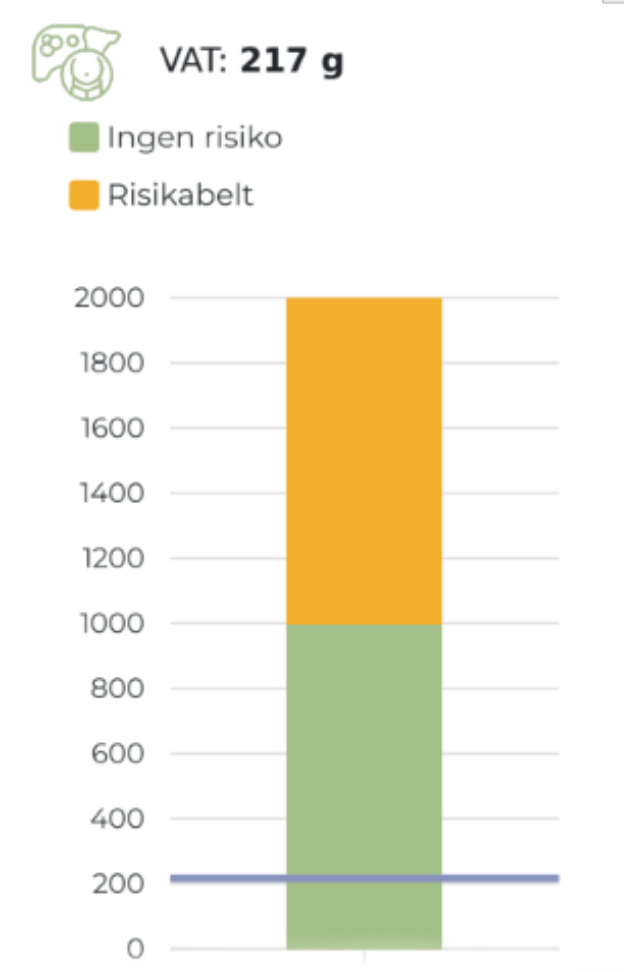
Visceral adipose tissue (VAT)
Visceral Adipose Tissue (VAT) indicates the estimated amount of fat surrounding the internal organs in the abdominal area. The amount depends on gender, age, and individual health status.
The Dexa scanner categorizes the body’s tissues into fat tissue, bone, and lean mass. It estimates how much fat is located around the organs in the abdominal region, since fat tissue allows a different amount of X‑rays to pass through compared to bone, muscle, and organs.
Read more here
The Dexa scanner categorizes the body’s tissues into fat tissue, bone, and lean mass. It estimates how much fat is located around the organs in the abdominal region, since fat tissue allows a different amount of X‑rays to pass through compared to bone, muscle, and organs.
Your scan’s VAT value is an estimate because the amount of fat is calculated by delineating the abdominal region during the scan’s post-processing. Higher VAT values are associated with a range of health risks, and we have compiled some information on the subject below.
Study with VAT recommendation: https://www.nature.com/articles/s41366-021-00743-3 In this study, GE brand scanners were used, which are from a different manufacturer than the scanner at Dexa Bodyscan. This may influence the values.
Age- and sex-specific changes in visceral fat mass throughout the life-span: https://onlinelibrary.wiley.com/doi/epdf/10.1002/oby.23779 In this study, GE brand scanners were used, which are from a different manufacturer than the scanner at Dexa Bodyscan. This may influence the values.
Reference values of body composition parameters and visceral adipose tissue (VAT) by DXA in adults aged 18–81 years—results from the LEAD cohort: https://www.ncbi.nlm.nih.gov/pmc/articles/PMC7402993/pdf/41430_2020_Article_596.pdf In this study, GE brand scanners were used, which are from a different manufacturer than the scanner at Dexa Bodyscan. This may influence the values.
Age- and Sex-Specific Reference Intervals for Visceral Fat Mass in Adults https://eprints.lancs.ac.uk/id/eprint/133162/1/VAT_accepted_version_240419.pdf The study maps preliminary reference values for VAT measured by DEXA in a population of both adult men and women with both average and athletic lifestyle. GE brand scanners were used in this study, which is a different manufacturer than the DEXA Body Scan scanner. This may have an influence on the values.
Mechanisms linking obesity with cardiovascular disease https://www.proquest.com/docview/204525581/fulltextPDF?pq-origsite=primo&sourcetype=Scholarly%20Journals This review examines the impact of obesity and VAT on insulin resistance (key element in the development of type 2 diabetes), increased blood pressure, blood coagulability, inflammation and atherosclerosis.
Body Fat Distribution, Incident Cardiovascular Disease, Cancer, and All-cause Mortality https://www.ncbi.nlm.nih.gov/pmc/articles/PMC4142485/ In this study, a statistical association between increased VAT and a number of diseases such as cardiovascular disease and cancer, as well as general mortality in Caucasian individuals is identified. The results are adjusted for age, gender, blood pressure, blood pressure treatment, diabetes, smoking status, cholesterol level and BMI. The study is based on CT scan measures of VAT.
Abdominal Visceral and Subcutaneous Adipose Tissue Compartments https://www.ahajournals.org/doi/epub/10.1161/CIRCULATIONAHA.106.675355 In this study, statistical correlation is observed between VAT and a number of health-related parameters including metabolic syndrome (elevated blood pressure and cholesterol, as well as increased waist circumference and increased fasting blood sugar). It is found that VAT has a statistically higher correlation with these parameters than other types of measures of the degree of fat around the organs. Adjustments were made for age, smoking status, alcohol intake, physical activity and, for women, menopausal status and hormone therapy.
Visceral Adiposity and the Risk of Metabolic Syndrome Across Body Mass Index https://pubmed.ncbi.nlm.nih.gov/25440591/ The study finds that visceral fat (measured by CT) is associated with cardiometabolic risk factors (insulin resistance, high blood pressure, cholesterol, metabolic syndrome, etc.) and coronary atherosclerosis. VAT was associated with these findings independent of BMI and any weight change.
Article about DEXA as a method for VAT measurement in relation to bioimpedance: https://www.frontiersin.org/journals/endocrinology/articles/10.3389/fendo.2023.1211696/full
Fat mass index (FMI)
The total amount of body fat relative to body weight, adjusted for height.
Fat mass index (FMI) relates your body’s fat tissue to your height, in contrast to Body mass index (BMI), which relates to total body weight. Thus, FMI accounts for the fat tissue itself in its assessment. Your Dexa report includes a table showing which FMI values correspond to the BMI thresholds for overweight.
Read more here
Fat is an integral part of our cells and cell membranes. Additionally, a portion of the brain consists of fat, as does our nervous system. Moreover, fat serves as both an energy source and an energy reserve, and it plays a role in temperature regulation. Very low fat levels can disrupt the body’s hormonal balance. Furthermore, dietary fat is important for the optimal absorption of the fat-soluble vitamins A, D, E, and K. These vitamins are essential for everything from bone health to immune function and blood clotting.
Read more about Dual Energy X‑Ray Absorptiometry Reference Values for body composition from NHANES

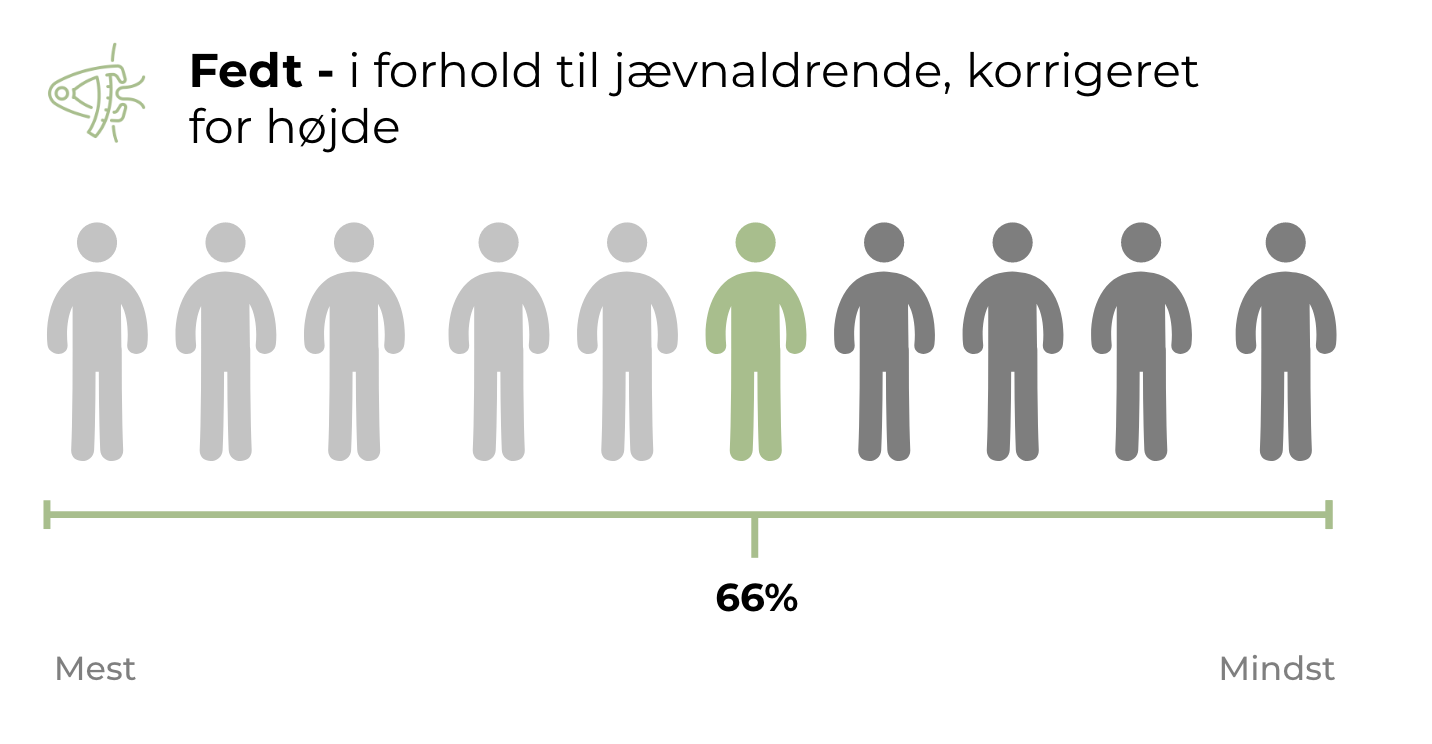
Age-matched peers
When the Dexa scan report refers to age-matched peers, it means scanned individuals of the same age from the NHANES database.
The NHANES database contains data on 20,000 individuals aged 8–85 years. Unfortunately, if you are over 85 years old, we cannot provide reference data for age-matched peers due to insufficient data.
Read more about Dual Energy X‑Ray Absorptiometry Reference Values for body composition from NHANES

Body fat
The amount of fatty tissue in the body.
The amount of fat tissue in the body. Body fat functions as an energy reserve and helps regulate temperature, but excessive accumulation can increase the risk of health problems such as cardiovascular disease and diabetes.
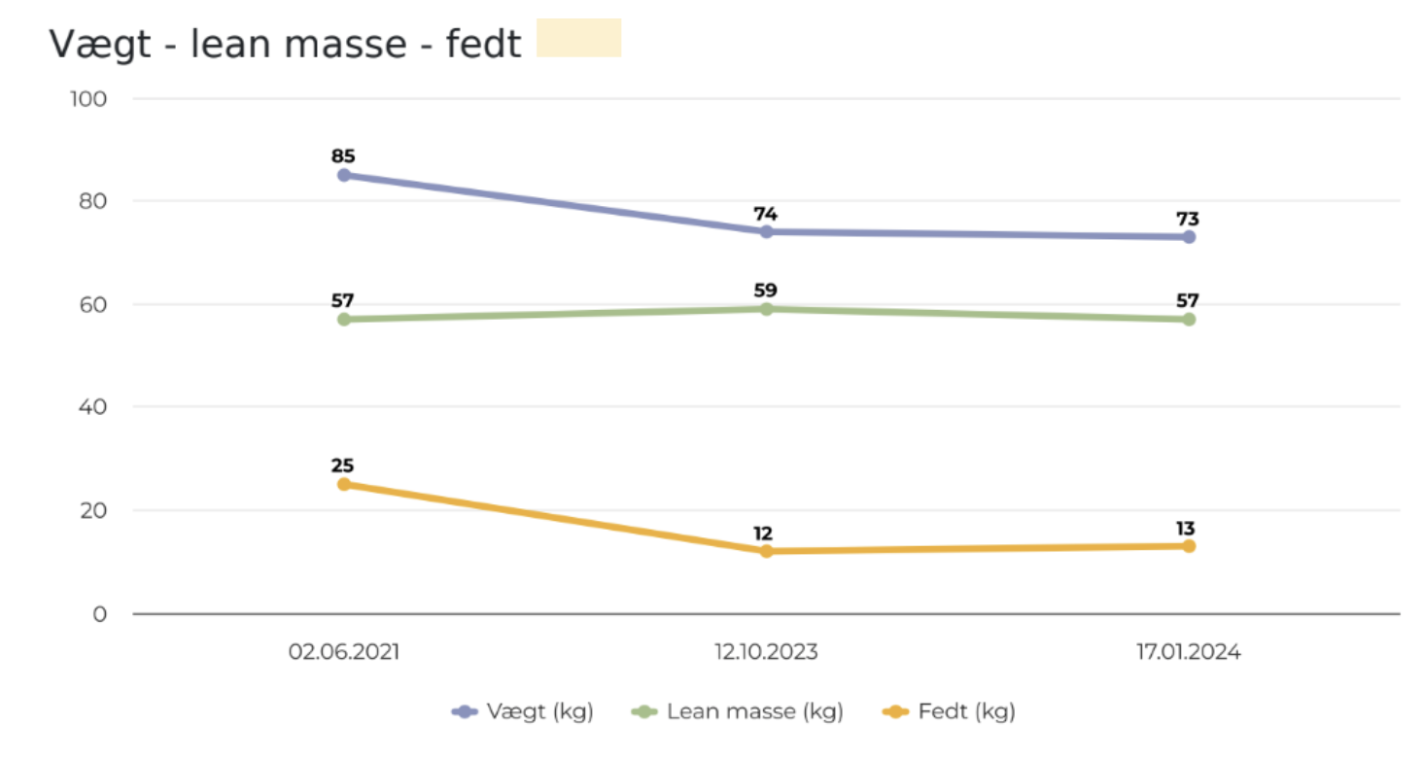
Lean mass
The portion of body weight that is not bone or fat tissue, but consists of muscle, tendons, ligaments, organs, etc. This value serves as a surrogate measure for muscle mass.
Muscle mass plays a crucial role in basal metabolism, energy expenditure, physical strength, and mobility. A pure measure of muscle mass is not possible because the tissue density of many soft tissues in the body is relatively uniform, causing them to attenuate X‑rays in nearly the same way, making it difficult to differentiate between them.
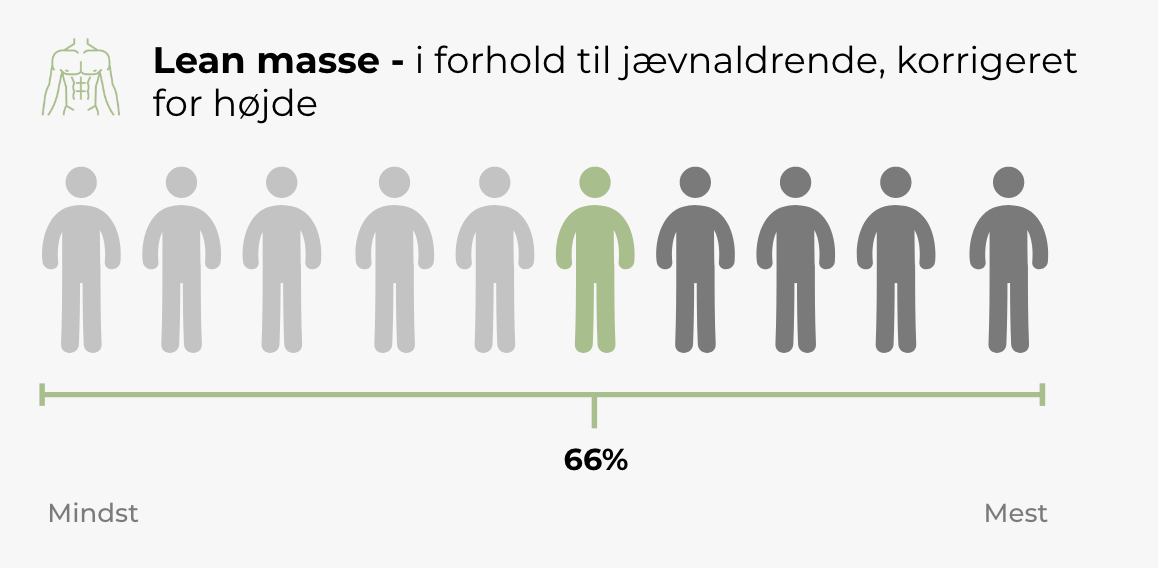
Lean mass index
The total amount of lean mass of body weight corrected for height.
The total amount of lean mass relative to body weight, adjusted for height. Lean mass index (LMI) relates your body’s lean mass to your height, as opposed to Body mass index (BMI), which considers your total body weight. This provides a more nuanced insight into your body composition.

NHANES (National Health and Nutrition Examination Survey)
The National Health and Nutrition Examination Survey (NHANES) is a program designed to assess the health and nutritional status of adults and children in the USA. NHANES continuously conducts health surveys of the American population and collects data on approximately 5,000 individuals each year through interviews, physical examinations, and medical tests. Since 1999, NHANES has performed Dexa full-body scans as part of their survey.
Read more here
Dexa Bodyscan compares scan results with data from the NHANES database. The data in the database is adjusted for age, gender, and ethnicity. The age range in the database is 8 to 85 years and includes over 20,000 people from the USA. The database information is from 2008 and 2012.
Read more about Dual Energy X‑Ray Absorptiometry Reference Values for body composition from NHANES
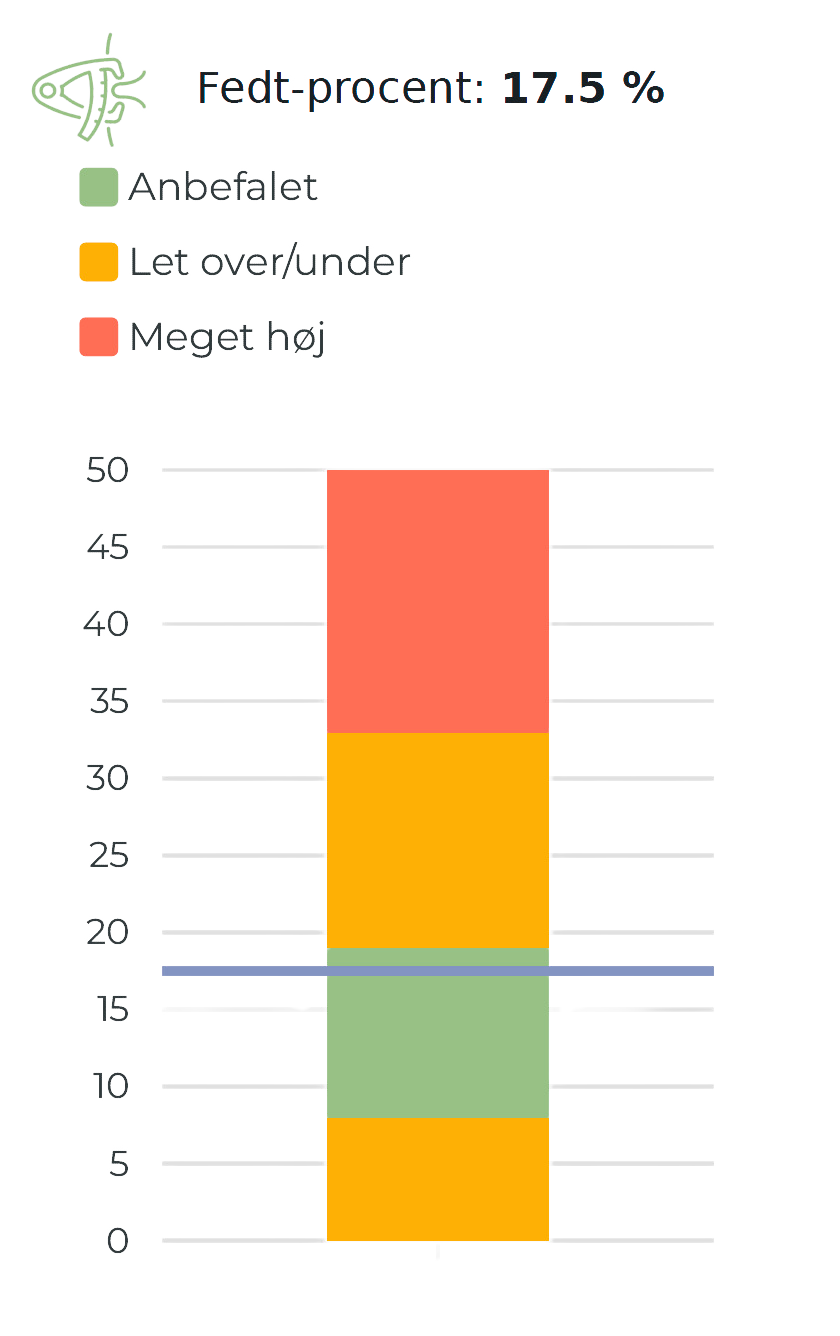
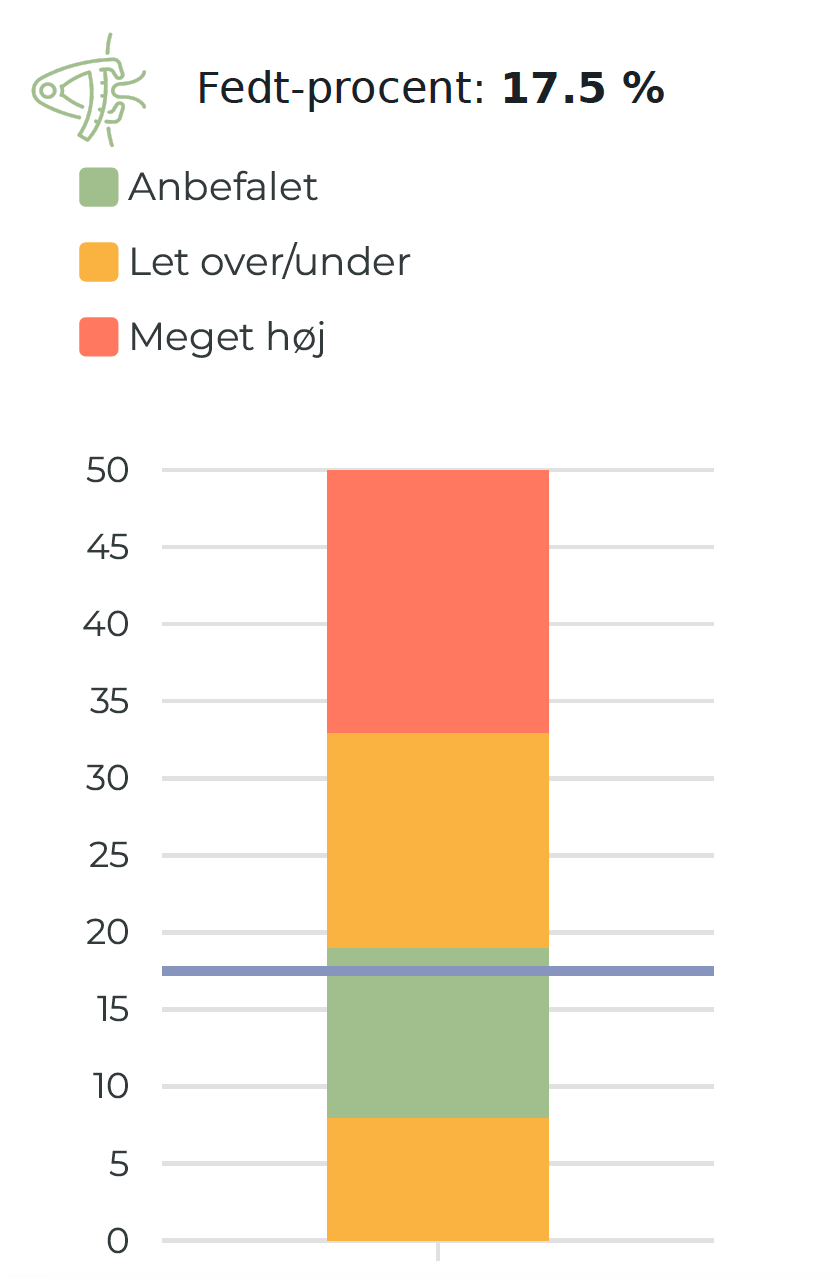
Percent body fat (PBF)
Percent body fat (PBF) is the percentage of your body weight that is made up of fat tissue.
It is used to assess your potential health risks. The recommended body fat percentage varies by age and gender—ranging from 21% to 36% for women (depending on age) and from 8% to 25% for men (depending on age), based on official WHO guidelines.
Read more here
Healthy percentage body fat ranges: an approach for developing guidelines based on body mass index https://pubmed.ncbi.nlm.nih.gov/10966886/ This study forms the basis for WHO’s guidelines. However, references and findings regarding body fat percentage are very heterogeneous, and there is no clear consensus.
T-score
The T‑score is a statistical measure used to determine if, and to what extent, your Bone mineral density (BMD) measurement deviates from the Peak Reference (the 20–29 age group, where bone density is at its highest). A BMD T‑score higher than –1 is considered normal. If the T‑score is below –2.5, an osteoporosis scan is recommended, as it indicates low bone density and a higher risk of fractures.
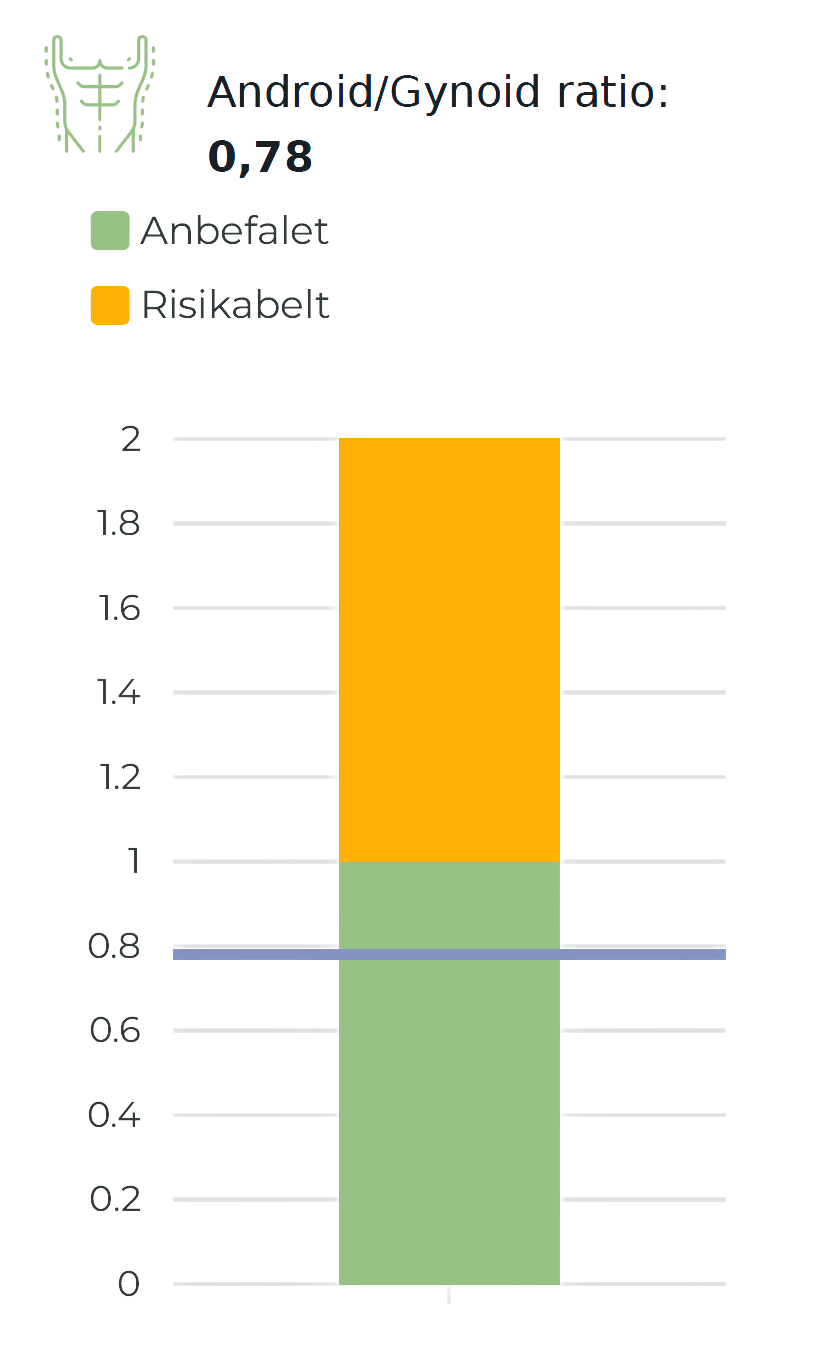
Waist-to-hip ratio
The distribution of fat in the body is expressed as the ratio between the fat percentage around the waist and that around the hips. A ratio over 1 indicates more waist fat, a ratio under 1 indicates more hip fat, and a ratio of 1 indicates an even distribution.
Increased waist fat is generally associated with a higher risk of health issues such as fatty liver, diabetes, and cardiovascular disease. However, total body fat is also important to consider, not just waist fat.
Read more here
Association of the android to gynoid fat ratio with nonalcoholic fatty liver disease: a cross-sectional study https://www.frontiersin.org/articles/10.3389/fnut.2023.1162079/full This study maps statistical correlations between increased waist-to-hip ratio measured by Dexa scanning and non-alcoholic fatty liver, which can lead to non-alcoholic liver fibrosis/cirrhosis (according to the “United States fatty liver index”). The study also presents findings on possible correlations between cholesterol levels (dyslipidemia), insulin resistance, and a higher waist-to-hip ratio. The same type of scanner used by Dexa Bodyscan was used in this study.
Central fatness and risk of all cause mortality: systematic review and dose-response meta-analysis of 72 prospective cohort studies https://www.bmj.com/content/bmj/370/bmj.m3324.full.pdf
This study shows a statistical correlation between a higher waist-to-hip ratio and mortality. This correlation persists even after adjustments for physical activity, alcohol consumption, smoking, and BMI. Waist-to-hip measurements were used in this study.
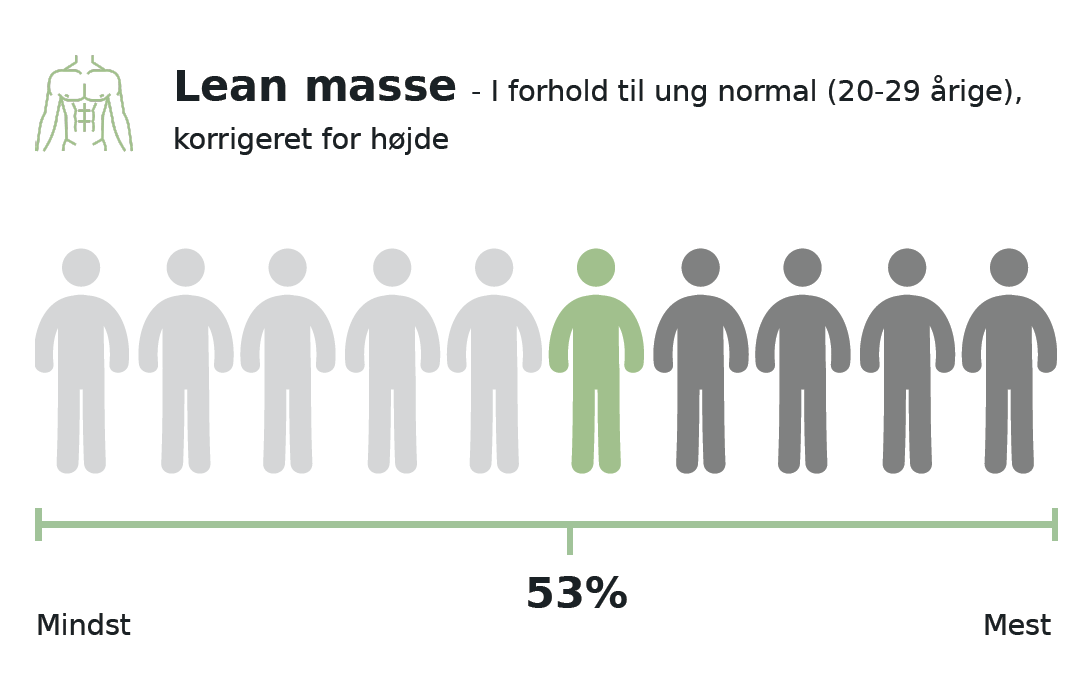
Young normal
Refers to data from individuals aged 20-–29—a group in which several physiological parameters, including bone density, are at their peak.
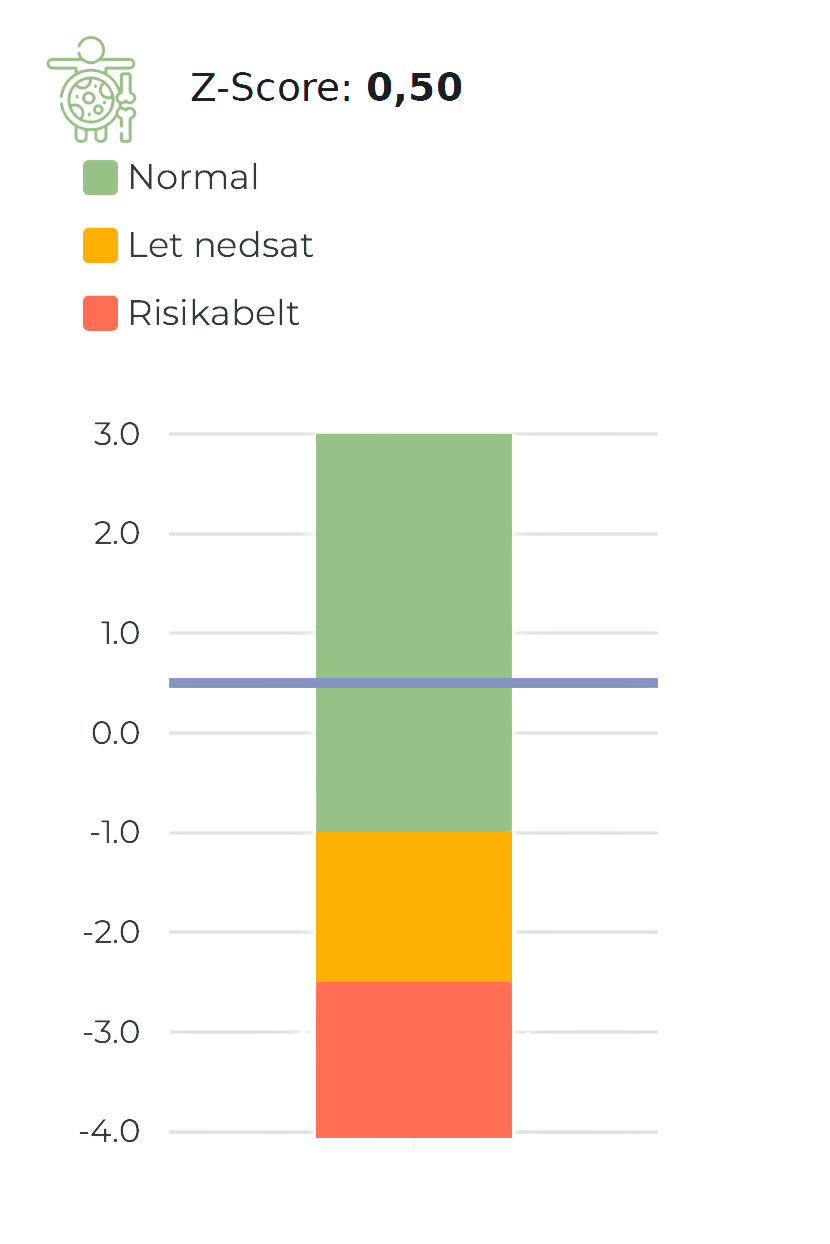
Z-score
The Z‑score is a statistical measure that indicates where your Bone mineral density (BMD) measurement falls relative to the average of your age-matched peers of the same gender.
A Z‑score of 0 corresponds to the average BMD for your age. A Z‑score below 0 means you are in the lower half of BMD for your age—the lower the number, the lower the BMD. A Z‑score above 0 means you are in the upper half—the higher the number, the higher the BMD.
